2017-11-18

Monitoring traceroute through Prometheus and Grafana

Last week, we faced a network outage at my client's.
We tried to gather facts to know more precisely when it started, to help the netops diagnose what was wrong.

And when we got all we could, it was mainly stats and figures from our application point of view, which is insufficient (and often considered as unreliable) for netops.
And needless to say that we have a proper monitoring but as we do not run it, it’s not for us to analyze ...

That’s where we, the project team, decided to setup our own monitoring.
And as I recently read a lot about Prometheus and Grafana, I decided it was high time to play with these new promising tools.
I simply installed Prometheus on my machine and node exporters on the machines I wanted to monitor. Then I plugged Grafana on top and using some dashboards available from the Grafana community, I quickly displayed relevant information about my servers.

But we were missing something, important to us : how to monitor the route our packets were following ?
Traceroute is obviously the answer, but I didn’t want to run a traceroute manually and on top of that, I had to be capable of saying when the route had changed.

Install and configure Prometheus

Just as a reminder on how Prometheus works, here is the diagram taken from the official documentation


We’re not going to use the docker image since I didn't find in the documentation how to mount a volume to be able to keep my data.
No need to configure something special, but the general config file.

Source : https://prometheus.io/docs/prometheus/latest/installation/

The prometheus.yml should look like that :

# my global config
global:
  scrape_interval:     15s # Set the scrape interval to every 15 seconds. Default is every 1 minute.
  evaluation_interval: 15s # Evaluate rules every 15 seconds. The default is every 1 minute.
  # scrape_timeout is set to the global default (10s).

# Alertmanager configuration
alerting:
  alertmanagers:
  - static_configs:
    - targets:
      # - alertmanager:9093

# Load rules once and periodically evaluate them according to the global 'evaluation_interval'.
rule_files:
  # - "first_rules.yml"
  # - "second_rules.yml"

# A scrape configuration containing exactly one endpoint to scrape:
# Here it's Prometheus itself.
scrape_configs:
  # The job name is added as a label `job=` to any timeseries scraped from this config.
  - job_name: 'prometheus'

    # metrics_path defaults to '/metrics'
    # scheme defaults to 'http'.

    static_configs:
      - targets: ['localhost:9090']

Once started, you should have the following log :
level=info ts=2017-11-18T16:40:40.3794356Z caller=main.go:215 msg="Starting Prometheus" version="(version=2.0.0, branch=HEAD)"
level=info ts=2017-11-18T16:40:40.3794809Z caller=main.go:216 build_context="(go=go1.9.2, user=root@615b82cb36b6, date=20171108-07:11:59)"
level=info ts=2017-11-18T16:40:40.3794976Z caller=main.go:217 host_details="(Linux 4.9.49-moby #1 SMP Wed Sep 27 23:17:17 UTC 2017 x86_64 (none))"
level=info ts=2017-11-18T16:40:40.3819182Z caller=web.go:380 component=web msg="Start listening for connections" address=0.0.0.0:9090
level=info ts=2017-11-18T16:40:40.3819422Z caller=main.go:314 msg="Starting TSDB"
level=info ts=2017-11-18T16:40:40.381969Z caller=targetmanager.go:71 component="target manager" msg="Starting target manager..."
level=info ts=2017-11-18T16:40:40.387602Z caller=main.go:326 msg="TSDB started"
level=info ts=2017-11-18T16:40:40.3876796Z caller=main.go:394 msg="Loading configuration file" filename=/etc/prometheus/prometheus.yml
level=info ts=2017-11-18T16:40:40.389357Z caller=main.go:371 msg="Server is ready to receive requests."

Configuring metrics scraping


Now it’s time to collect metrics.
The most usual way to do it is to use exporter (node exporter is a standard way to do it) or to code a collection point. This is the principle where Prometheus asks for metrics.
I've then setup a "node_exporter" on one of my Rasp (you can follow Alex Ellis' article if you want to know how) and I simply added an entry in my prometheus.yml, such as :

  - job_name: rpi
    static_configs:
      - targets: ['192.168.0.69:9100']
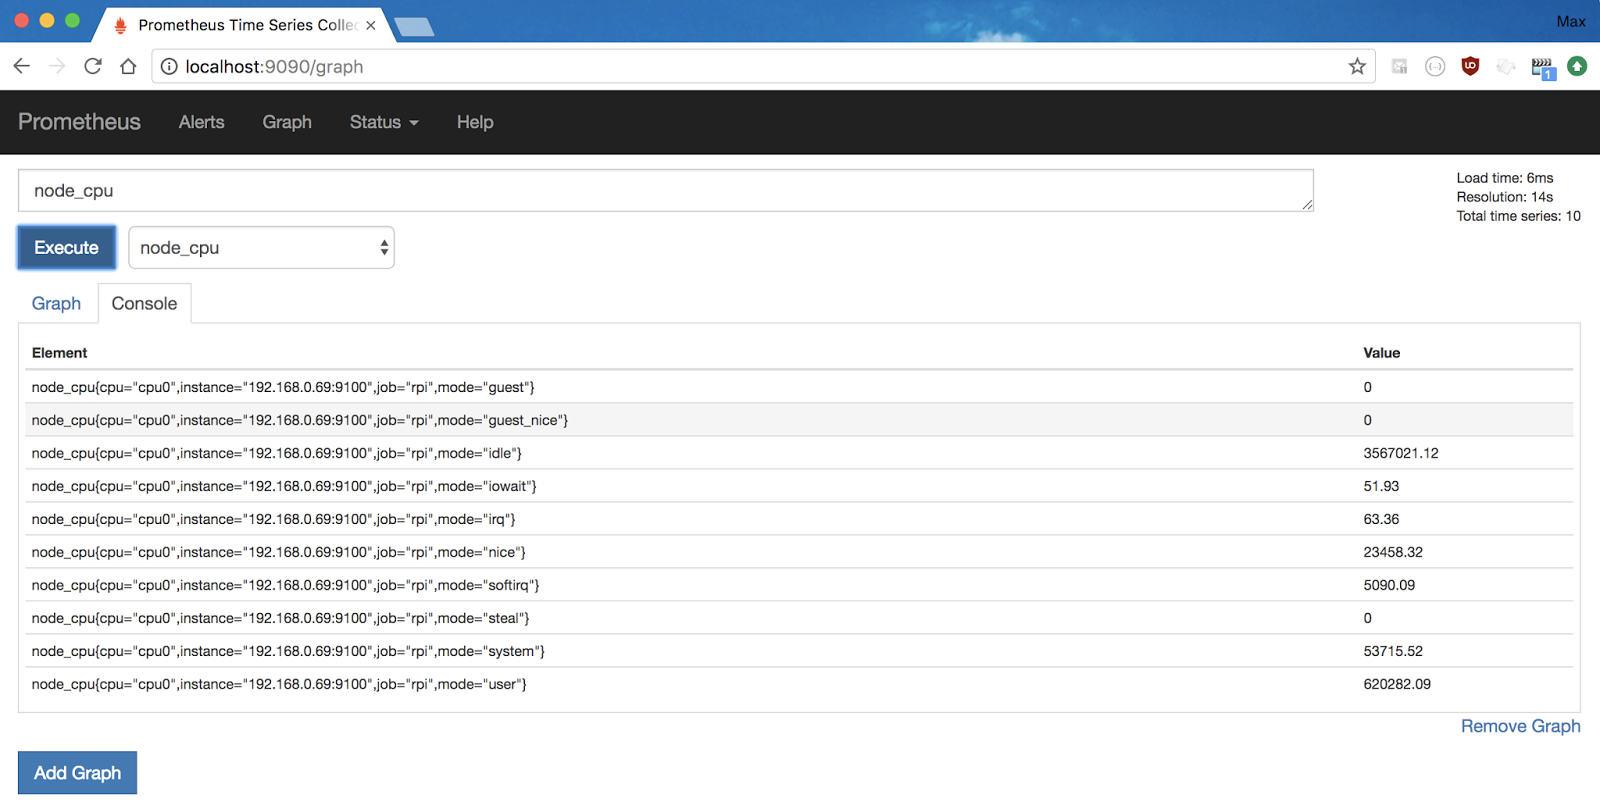
After a restart, Prometheus starts gathering information about the machine you're collecting data from.
You can verify this by using the Prometheus console, which now shows lots of metrics starting with "node"


Now, what we are going to do is slightly different : we want to monitor the traceroute from the local machine (also the machine where Prometheus server is running) to the destination machine.
Thus, we are not going to « scrape » a distant machine but the local machine thanks to the Pushgateway, in its dockerized form.

docker run -d -p 9091:9091 --name pushgateway prom/pushgateway
Then let's configure Prometheus to scrape from the "pushgateway". Just add the following section at the end of your prometheus.yml and restart Prometheus.
  - job_name: traceroute
    static_configs:
      - targets: ['localhost:9091']
But in order to be able to use the keyword "instance", you will have to add an option to the job section, in your prometheus.yml
  - job_name: traceroute
    honor_labels: true
    static_configs:
      - targets: ['localhost:9091']
To know why using the keyword "instance" is important, I strongly encourage you to read the doc, by following the link below !
(And there's an explanation at the end of the article)

Source : https://prometheus.io/docs/prometheus/latest/configuration/configuration/#scrape_config

We are going to test our system by sending random values.
max$ echo "fake_number 16" | curl --data-binary @- http://localhost:9091/metrics/job/traceroute
max$ echo "fake_number 11" | curl --data-binary @- http://localhost:9091/metrics/job/traceroute
max$ echo "fake_number 31" | curl --data-binary @- http://localhost:9091/metrics/job/traceroute
max$ echo "fake_number 1"  | curl --data-binary @- http://localhost:9091/metrics/job/traceroute
Note that you have to define the same job name at the end of the URL and in the prometheus.yml.

Now, if you look at the Prometheus console, you can see your graph with the information we added thanks to our HTTP requests.

Test values are fine, but we want something meaningful. Let's replace the test command by a real traceroute, but where we will just count the number of hops.
echo "traceroute_hops{instance=\"192.168.0.69:9100\"} $(traceroute 192.168.0.69 | grep -e "^ [0-9]" -e "^[0-9]" | wc -l)" \
| curl --data-binary @- http://localhost:9091/metrics/job/traceroute
This line adds a metric to our job with the number of hops to reach our destination.

I'm aware that it is not useful to monitor a Rasp on the same LAN :) it's just for demonstration purposes

And in order to have some history, just add this line to your crontab, with the desired frequency of execution.

Pushing the monitoring to the next level with Grafana


First, let's install Grafana in its dockerized form
docker run -d --name=grafana -p 3000:3000 grafana/grafana
Source : https://hub.docker.com/r/grafana/grafana/

Log in to the Grafana console (admin/admin) and click on "Add data source"


Add the Prometheus datasource, such as :


Then, import a dashboard from the community (the link points to one of the most downloaded dashboards), by first downloading the JSON file :


And then by feeding Grafana with it (and then select the Prometheus data source) :


Et voilà ! Your first dashboard ! And yes, the Rasp I'm monitoring is 2B+ :)


Now, we need to add the last piece : the monitoring of the traceroute command.
To do so, go to the end of the page and click "+ Add row"
Then click on the panel title and choose "Edit"


In the "Metrics" tab, choose the prometheus datasource :


And then start to type "traceroute" in the A field. The autocompletion should do the rest. Select the name "traceroute_hops" :


Now, we have the stat based on the number of hops showing !


You can change the panel title in the "General" tab, and the "legend" in the "Legend Format" textfield.

To make it even more clear on our dashboard, we will add a "single stat" panel.
In the "Options" tab, define "Stat" to "Current", check the "Background" box and set the thresholds to "1,1", which means that the only valid value is 1.


If the counter differs from 1, the background turns red :


Viewed from the final dashboard (not the edition view).
KO :


And then OK again :


If more than one server is being monitored, we need to modify the metric query, so we only view information from the Grafana current node (the machine(s) selected from the top dropdown menu):
traceroute_hops{instance=~'$node'}
That's the reason why we had to add the option "honor_labels: true". And if you enter "{{instance}}" in the "Legend format" textfield, it will display the name of the current node.

2017-11-11

Using a dockerized Nexus as a Docker registry

Recently, I was playing with Docker Swarm and I decided to setup a containerized Nexus as my Docker registry.
But to be able to work as a Docker registry, you need to use HTTPS.
I found lots of article about using Nexus as a docker registry, but not a containerized Nexus. That's what I'm going to describe.
A solution is to use a proxy, let it handle the security and use plain HTTP between the proxy and Nexus, but that’s not what I’m interested in.

Install dockerized Nexus

That part is the easiest one :)
Although it’s not the recommended way to do it, I’m going to use a mounted volume. I find it easier to manipulate what's inside that way.

$ mkdir /some/dir/nexus-data && chown -R 200 /some/dir/nexus-data 
$ docker run -d -p 8081:8081 -p 8082:8082 --name nexus -v /some/dir/nexus-data:/nexus-data sonatype/nexus3

Note that, despite of the command line given in the doc, we are opening two ports since we need another one for HTTPS. Choose it carefully as it will be used after.

Source : https://github.com/sonatype/docker-nexus3

Once you start Nexus, you can see the /some/dir/nexus-data directory growing.
Content of nexus-data :

total 56
drwxr-xr-x  22  max staff 748B 4 nov 10:13 .
drwxr-xr-x  4   max staff 136B 2 nov 23:15 ..
-rw-r--r--@ 1   max staff 8,0K 2 nov 23:15 .DS_Store
-rw-------  1   max staff 524B 4 nov 09:49 .bash_history
-rw-rw-r--  1   max staff 53B  2 nov 22:06 .install4j
drwxr-xr-x  3   max staff 102B 2 nov 22:06 .oracle_jre_usage
drwxr-xr-x  2   max staff 68B  2 nov 22:06 backup
drwxr-xr-x  3   max staff 102B 2 nov 22:06 blobs
drwxr-xr-x  260 max staff 8,6K 4 nov 10:14 cache
drwxr-xr-x  11  max staff 374B 2 nov 22:06 db
drwxr-xr-x  4   max staff 136B 2 nov 22:29 elasticsearch
drwxr-xr-x  6   max staff 204B 5 nov 09:53 etc
drwxr-xr-x  2   max staff 68B  2 nov 22:06 generated-bundles
drwxr-xr-x  2   max staff 68B  2 nov 22:06 health-check
drwxr-xr-x  3   max staff 102B 2 nov 22:06 instances
drwxr-xr-x  3   max staff 102B 2 nov 22:06 javaprefs
drwxr-xr-x  4   max staff 136B 2 nov 22:17 keystores
-rw-r--r--  1   max staff 14B  4 nov 10:13 lock
drwxr-xr-x  10  max staff 340B 5 nov 01:07 log
drwxr-xr-x  2   max staff 68B  2 nov 22:06 orient
-rw-r--r--  1   max staff 5B   4 nov 10:13 port
drwxr-xr-x  49  max staff 1,6K 4 nov 10:14 tmp

The 3 directories in bold are the ones we are going to use next.

Adding a valid name for our certificate

In real life, your certificate should match the DNS or machine on which you're hosting Nexus.
But in my case, it's just a local environment for testing purpose.
So I just added a value in /etc/hosts

127.0.0.1 nexus

Creating JKS

As Jetty is the underlying web container, a JKS (Java KeyStore) is needed to contain your certificate.
Here, we are going to use a CSR.

First, go to the directory /some/dir/nexus-data/keystores and then create your CSR.

keytool 
 -genkeypair 
 -keystore keystore.jks 
 -storepass changeit 
 -keypass changeit 
 -alias jetty 
 -keyalg RSA 
 -keysize 2048 
 -validity 5000 
 -dname "CN=nexus, OU=MyUnit, O=MyOrg, L=MyLoc, ST=MyState, C=FR" 
 -ext "SAN=DNS:nexus,IP:127.0.0.1" 
 -ext "BC=ca:true"

Source : https://support.sonatype.com/hc/en-us/articles/217542177-Using-Self-Signed-Certificates-with-Nexus-Repository-Manager-and-Docker-Daemon

Updating the configuration


jetty-https.xml

Since the dockerized image of Nexus expose only the directory /nexus-data through a volume, we don’t have access to the HTTPS configuration, which is located in /opt/sonatype/nexus/etc/jetty/jetty-https.xml.
To do so, let’s create a writable jetty configuration directory.

mkdir /some/dir/nexus-data/etc/jetty

Then start your dockerized Nexus and launch a bash prompt.

docker start nexus
docker exec -it nexus bash

Once in the container, copy the file jetty-https.xml so that it’ll be accessible from the host and not deleted every time we relaunch the container.

bash> cp /opt/sonatype/nexus/etc/jetty/jetty-https.xml /nexus-data/etc/jetty/

Edit the file jetty-https.xml and modify the section accordingly :

<new id="sslContextFactory" class="org.eclipse.jetty.util.ssl.SslContextFactory">   
<set name="KeyStorePath">/nexus-data/keystores/keystore.jks</set>
<set name="KeyStorePassword">changeit</set>   
<set name="KeyManagerPassword">changeit</set>
<set name="TrustStorePath">/nexus-data/keystores/keystore.jks</set>
<set name="TrustStorePassword">changeit</set> 
[ … ]

As you can see, we deleted the property name « ssl.etc » since it tells jetty to look for the path under /etc/ssl, which a directory we cannot modify within the container.

nexus.properties

Then edit the file /some/dir/nexus-data/etc/nexus.properties to uncomment the line enabling the HTTPS port, and write the value you defined when you created your container.

application-port-ssl=8082

Uncomment and modify the line allowing to tweak jetty configuration.

nexus-args=${jetty.etc}/jetty.xml,${jetty.etc}/jetty-http.xml,${jetty.etc}/jetty-requestlog.xml,/nexus-data/etc/jetty/jetty-https.xml

Then restart your container and tail the log.

docker start nexus;tail -500f /some/dir/nexus-data/log/nexus.log

You should observe the correct opening of both HTTP and HTTPS ports.

2017-11-04 09:14:16,900+0000 INFO [jetty-main-1] *SYSTEM
 org.eclipse.jetty.server.AbstractConnector - Started ServerConnector@276df136{HTTP/1.1,[http/1.1]}{0.0.0.0:8081}
2017-11-04 09:14:16,910+0000 INFO [jetty-main-1] *SYSTEM 
org.eclipse.jetty.util.ssl.SslContextFactory - x509=X509@4f12e7b6(jetty,h=[nexus],w=[]) 
for SslContextFactory@5fc3c41c(file:///nexus-data/keystores/keystore.jks,file:///nexus-data/keystores/keystore.jks)
2017-11-04 09:14:16,946+0000 INFO [jetty-main-1] *SYSTEM 
org.eclipse.jetty.server.AbstractConnector
- Started ServerConnector@287f5f5{SSL,[ssl, http/1.1]}{0.0.0.0:8082}

Source : https://help.sonatype.com/display/NXRM3/Configuring+SSL#ConfiguringSSL-InboundSSL-ConfiguringtoServeContentviaHTTPS

Our certificate is self-signed, that's why it is considered not valid by the browser.

Configure Docker Daemon to trust the certificate

You'll now have to configure the docker daemon to trust your certificate.
I'm not going to describe something that has already have been : just look at the description at the end of this article and you're good to go.